Short answer
To estimate CRO ROI, multiply your monthly visitors by your conversion rate, average order value and the expected lift. That's the extra revenue per month. Apply your margin, compare it with the cost of the work, and you get the payback time. In my case studies, a single well-researched page moved its main metric by 8–20%, and pages with an obvious problem moved more.
Key takeaways
- Extra revenue = visitors × conversion rate × average order value × lift.
- Use profit, not revenue, to judge payback: multiply by your margin.
- Only count the traffic that sees the page you change.
- Realistic lifts for one page are 5–20%. Bigger numbers usually mean the old page was broken.
- Not every test wins, so budget for a few attempts, not one.
Before you spend money on conversion rate optimization, you should know roughly what a win is worth. It's a simple calculation, and it tells you how much you can sensibly spend on research, design and testing. Put your own numbers into the calculator below.
Free calculator
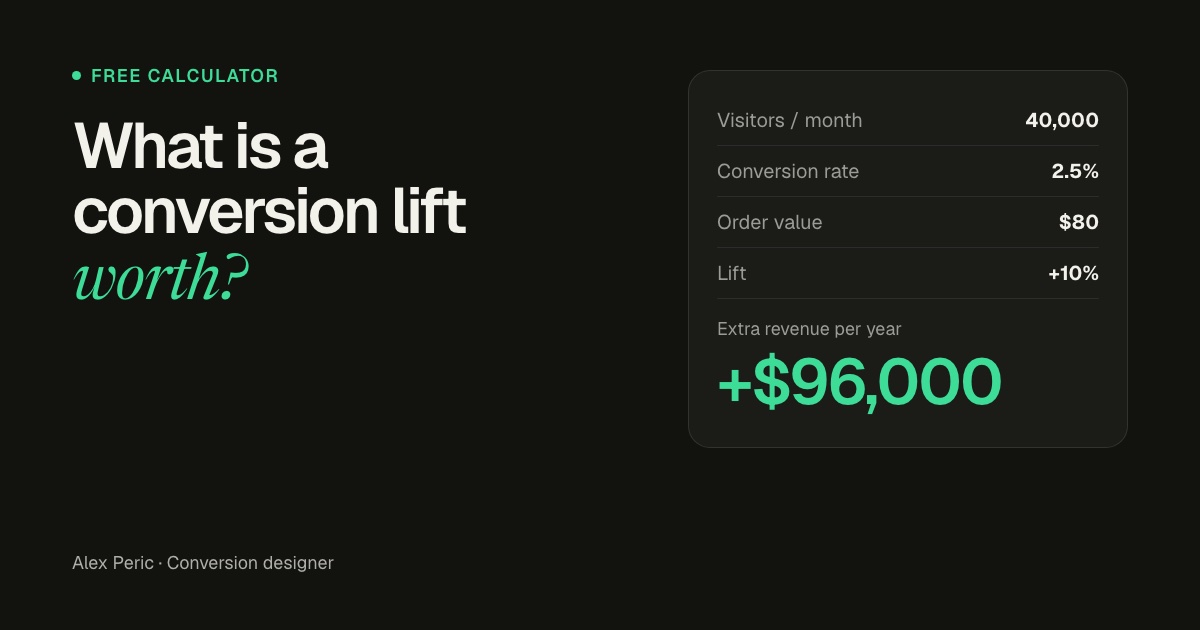
What is a conversion lift worth?
Works for leads too: use the value of a lead (or of a lead multiplied by your close rate) as the order value.
The formula behind it
Here's the same calculation by hand, with the example numbers in the calculator:
- Orders now: 40,000 visitors × 2.5% = 1,000 orders a month.
- Extra orders: 1,000 × 10% lift = 100 more orders a month.
- Extra revenue: 100 × $80 = $8,000 a month, or $96,000 a year.
- Extra profit: $96,000 × 40% margin = $38,400 a year.
- Payback: $6,000 ÷ $3,200 profit a month = under two months.
Two things people often get wrong: they apply the lift to the whole site's revenue when only one page changed, and they compare the cost with revenue instead of profit. Count only the visitors who see the page you're changing, and use your margin.
What lift is realistic?
This is where most ROI estimates go wrong. Agencies quote their best-ever result. Here's every result from my own case studies, so you can see the range for each type of page.
What 15 A/B-tested redesigns moved
Main result of each redesign against the original page. Each one ran as an A/B test. Not shown: the made-to-order oxfords page, where the goal was a drop (−21,3% cancellations before shipping).
Show the numbers as a table
| Item | Value |
|---|---|
| Solar Installer (leads) | +57,3% |
| Dental Implant Practice (consultation requests) | +41,8% |
| HVAC Company (booked visits) | +27,4% |
| Proposal Software (trial starts) | +19,8% |
| Salon Software (demo bookings) | +16,8% |
| Men's Face Wash (revenue per visitor) | +16,1% |
| Interactive Proposals (trial starts) | +14,2% |
| Product Adoption SaaS (demo requests) | +12,6% |
| Small Business CRM (trial starts) | +12,1% |
| Seafood Subscription (subscriptions started) | +11,7% |
| Cast Iron Skillet (conversion rate) | +10,4% |
| Custom Pillow (conversion rate) | +9,2% |
| Spore Probiotic (subscription conversion rate) | +8,6% |
| Air Purifier (revenue per visitor) | +8,2% |
| Golf Irons (conversion rate) | +8,1% |
The pattern is consistent:
- Ecommerce product pages moved 8–16%. These pages usually already work, so the gains come from answering doubts better.
- SaaS homepages and demo pages moved trial starts and demo bookings by 12–20%, mostly by explaining the product faster and making the first step easier.
- Local landing pages for ads moved leads by 27–57%. The originals sent paid traffic to a homepage with no clear next step, so there was more to fix.
For a planning number, use 5–10% for a page that already converts reasonably and 15–25% for a page with a clear problem. If the payback still looks good at 5%, the project is an easy yes.
What to count as cost
- Research and design: the audit, wireframes, copy and final design.
- Build: development time, or a designer who builds it.
- Testing: your A/B testing tool, and the weeks the test runs.
- Your time: reviews, feedback and approvals.
Also budget for losing tests. Not every idea wins: Frictionless Commerce describes one client where it took 13 test variations over 90 days to find a winner. A program of several tests on your most important pages is a safer bet than one big redesign.
When CRO isn't worth it yet
If a 10% lift on your traffic is worth less than the cost of the work, fix traffic or offer first. CRO multiplies what you already have. With a few hundred visitors a month there isn't much to multiply, and you won't have enough traffic for a reliable A/B test either (see the sample size calculator).
FAQ
How do you calculate CRO ROI?
Multiply monthly visitors by conversion rate, average order value and the expected lift to get extra monthly revenue. Multiply by your margin to get extra profit, then divide the cost of the work by the monthly extra profit to get the payback time in months.
What is a good conversion rate lift?
For a single page that already works, 5–10% is a solid result. Pages with a clear problem, like ad traffic landing on a generic homepage, can move 20% or more. In my 16 case studies, results ranged from +8,1% to +57,3%.
How long does it take for CRO to pay off?
It depends on traffic and order value. For a store with tens of thousands of monthly visitors, a 10% lift on a key page often pays for the work in a few months. With low traffic it can take much longer.
Does CRO work for lead generation?
Yes. Use the value of a lead instead of an order value. If you know your close rate, multiply the deal value by it to get the value of one lead.
Sources

Conversion designer. I design and build product pages, landing pages and websites, A/B test them and show what each change earned. CXL certified in Conversion Optimization and Ecommerce Marketing, and a guest speaker at NYU School of Professional Studies.